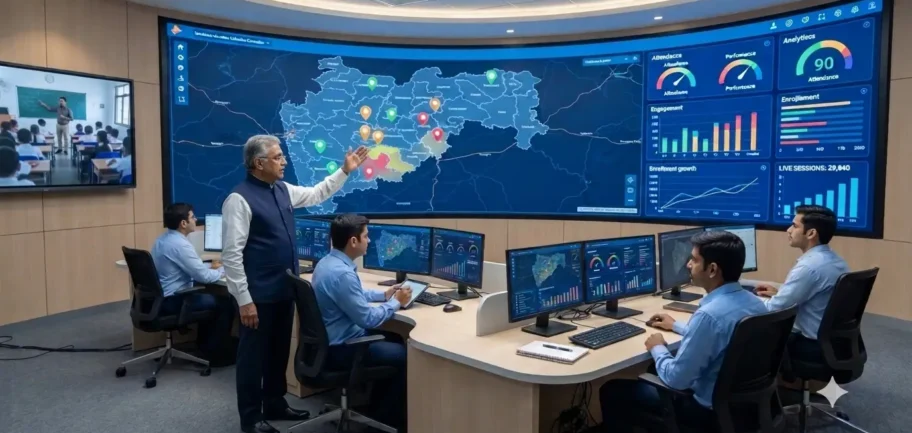
See Every Classroom, Anywhere, and Turn Activity into Instant Insight
Our GIS Command Dashboard gives administrators a live, map-based view of every classroom, campus, and learning center in your network. Real-time analytics layered on top give educators and administrators instant visibility into attendance, engagement, and performance, so decisions are made instantly, not weeks after the fact.
Real-Time Location Mapping
Every campus, classroom, and studio is plotted live on an interactive map, giving leadership instant geographic visibility across the network. Monitor infrastructure status, session activity, and connectivity across every location from a single command screen.
Geo-Tagged Performance Data
Attendance, engagement, and academic performance metrics are layered directly onto the map by region, district, or campus. Consolidated views show academic performance across students, classes, and institutions.
Live Attendance and Engagement Monitoring
Automatic, real-time attendance capture across every classroom and session. Student participation and attention levels are tracked as lessons happen.
Rapid Issue Detection and Actionable Reporting
Instantly identify locations facing connectivity, attendance, or performance issues so support teams can respond before problems escalate. Clear, exportable reports help administrators make informed decisions quickly.
How it Works
Map the Network & Capture Data
Every classroom and campus location is geo-tagged and connected to the dashboard. Attendance, engagement, and performance data is collected automatically during every session.
01
02
Monitor & Process in Real Time
Our analytics engine processes data instantly, updating dashboards live. Administrators track real-time status, sessions, and performance across all locations from one screen.
Respond, Act & Optimize
Geographic insights help leadership prioritize support, resources, and interventions where they’re needed most. Teachers and administrators use real-time reports to make immediate, informed decisions.
03
Frequently Asked Questions
1. What can administrators see on the GIS Command Dashboard?
Every campus, classroom, and studio in the network is plotted on one interactive map. Administrators can see infrastructure status, live session activity, connectivity, attendance, engagement, and academic performance, and filter by region, district, or campus.
2. How is attendance captured?
Attendance is captured automatically during every session, with no manual registers. It appears on the dashboard live, for each classroom and session.
3. How quickly does the data update?
Data is processed instantly and dashboards update live during sessions. Administrators and teachers can act the same day, instead of waiting for end-of-month reports.
4. Can we find out which locations have connectivity or performance problems?
Yes. The dashboard flags locations facing connectivity, attendance, or performance issues, so support teams can respond before problems escalate.